
Orthogonal Grid Point Set Outer Contours
Description:
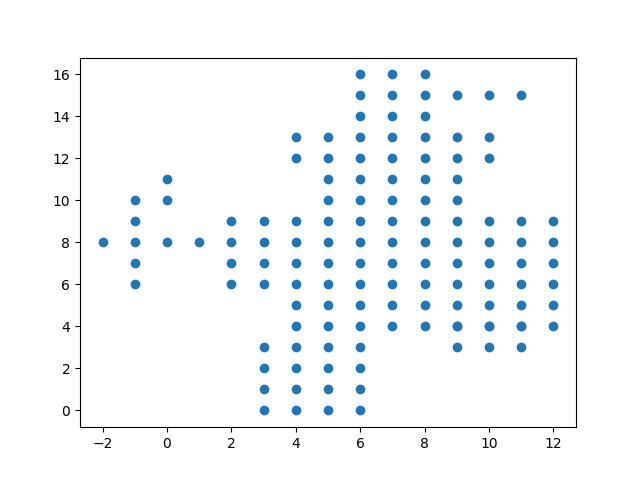
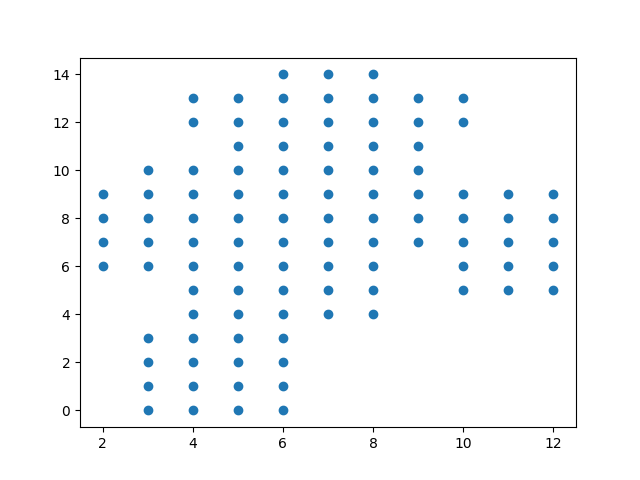
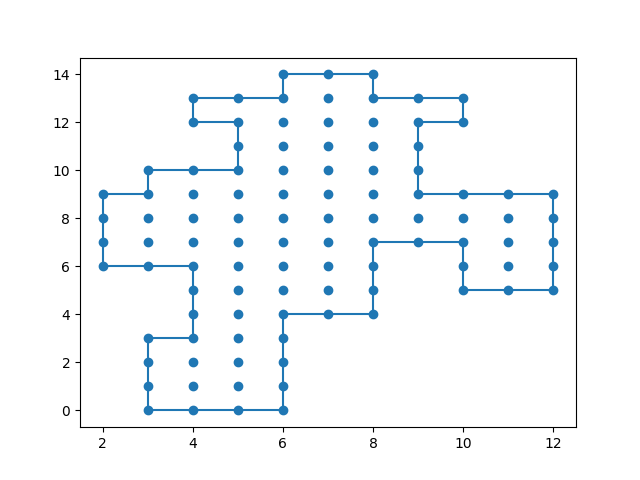
A set of points on an orthogonal grid
- Point sets allow for internal voids.
- Single-point/single-line branching is allowed.
- Blocks of points connected by branches are allowed.
Condition:
The set of unordered coordinates of a known set of points.
Algorithm:
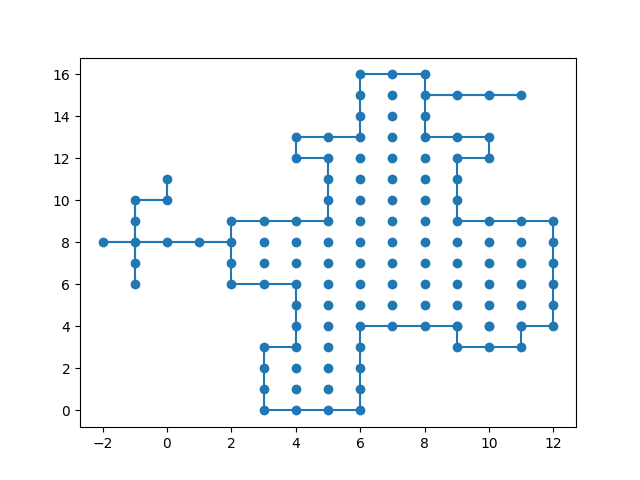
The outer contour of the collective.
Code Illustrate:
- The outer contours of a regular set are not unique. Additional constraints are required, such as maximum area, maximum contour line perimeter, convex clad line, and so on.
- This algorithm is the smallest footprint of the set.
- Python demonstration algorithm and graphical explanation.
- This orthogonal algorithm is purely original code and does not reference other sets of geometric algorithms.
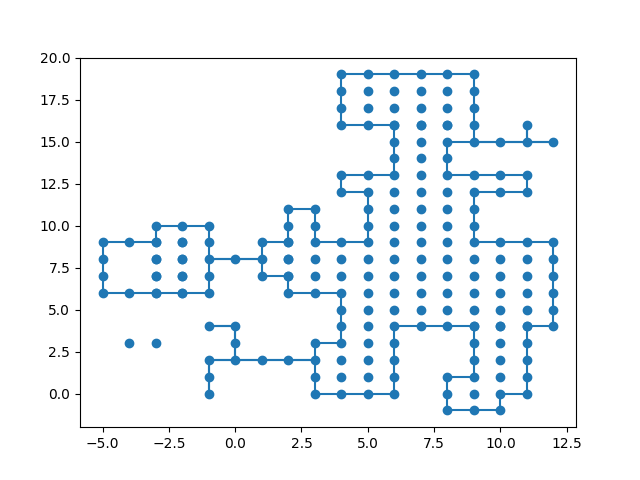
Example image:

Code:
-- Version 2 --- Spec:
1- Support for graphics with "single line branches"
2- Support with "branch-area block"
###################################################################
##
## Spec:
## 1. Support for graphics with "single line branches"
## 2. Support with "branch-area block"
##
## 特点:
## 1. 支持 含有“单线分支”的图形轮廓线
## 2. 支持 含有“分支-区域块”的图形轮廓线
##
###################################################################

import matplotlib.pyplot as plt
import Data3 as Data

def XYMaxPoint(PList):
    Xmax = max(i[0] for i in PList)
    Xlist = []
    for poi in PList:
        if poi[0] == Xmax:
            Xlist.append(poi)
    Ymax = max(i[1] for i in Xlist)
    return [Xmax, Ymax]

def NextPoi(P, PList):
    Unit = 1.0
    Poi_B = []
    TList = []
    Grid_4 = [[P[0] + Unit, P[1]], [P[0] - Unit, P[1]],
              [P[0], P[1] + Unit], [P[0], P[1] - Unit]]
    for i in Grid_4:
        if i in PList:
            TList.append(i)
    for A in TList:
        k = 1
        for B in TList:
            Wise = (A[0] - P[0]) * (B[1] - P[1]) - \
                (A[1] - P[1]) * (B[0] - P[0])
            if Wise < 0:
                k = 0
        if k == 1:
            Poi_B = A
    return Poi_B, len(TList)

def plot2D(x, y, x_out, y_out):
    plt.scatter(x, y)
    plt.plot(x_out, y_out)
    plt.show()

if __name__ == '__main__':
    PPs = Data.Points.copy()
    PoiStart = XYMaxPoint(Data.Points)
    print(PoiStart)
    Poi_A = PoiStart
    RList = []
    Poi_B = []
    n = 0
    while Poi_B != PoiStart:
        Poi_B, N = NextPoi(Poi_A, PPs)
        if N > 1:
            RList.append(Poi_A)
            PPs.remove(Poi_A)
            Poi_A = Poi_B
        elif N == 1:
            RList.append(Poi_A)
            PPs = Data.Points.copy()
            PPs.remove(Poi_A)
            Poi_A = Poi_B
        else:
            RList.append(Poi_A)
            PPs = Data.Points.copy()
            PPs.remove(Poi_A)
        n = n + 1
        if n == 2:
            PPs.append(PoiStart)
    RList.append(PoiStart)
    XList = [i[0] for i in Data.Points]
    YList = [i[1] for i in Data.Points]
    X_OutList = [i[0] for i in RList]
    Y_OutList = [i[1] for i in RList]
    plot2D(XList, YList, X_OutList, Y_OutList)
-- Version 1.3 --
Spel:
1 . Support for graphs with single-line branches.
2 . Single-line branching You cannot connect a branch-area block.
3 . The connection point of the branch area block has not been judged and has been deleted by the scan line. Therefore, the area contour cannot be closed at the connection point.
#
# 不支持 “单线分支”的图形集合
#
import matplotlib.pyplot as plt
import Data2 as Data


def XYMaxPoint(PList):
    Xmax = max(i[0] for i in PList)
    Xlist = []
    for poi in PList:
        if poi[0] == Xmax:
            Xlist.append(poi)
    Ymax = max(i[1] for i in Xlist)
    return [Xmax, Ymax]


def NextPoi(P, PList):
    Unit = 1.0
    Poi_B = []
    TList = []
    Grid_4 = [[P[0] + Unit, P[1]], [P[0] - Unit, P[1]],
              [P[0], P[1] + Unit], [P[0], P[1] - Unit]]
    for i in Grid_4:
        if i in PList:
            TList.append(i)
    for A in TList:
        k = 1
        for B in TList:
            Wise = (A[0] - P[0]) * (B[1] - P[1]) - \
                (A[1] - P[1]) * (B[0] - P[0])
            if Wise < 0:
                k = 0
        if k == 1:
            Poi_B = A
    return Poi_B


def plot2D(x, y, x_out, y_out):
    plt.scatter(x, y)
    plt.plot(x_out, y_out)
    plt.show()

if __name__ == '__main__':
    PPs = Data.Points.copy()
    PoiStart = XYMaxPoint(Data.Points)
    Poi_A = PoiStart
    RList = []
    Poi_B = []
    n=0
    while Poi_B != PoiStart:
        Poi_B = NextPoi(Poi_A, PPs)
        if Poi_B != []:
            RList.append(Poi_A)
            PPs.remove(Poi_A)
            Poi_A = Poi_B
        else:
            PPs = Data.Points.copy()
            RList.append(Poi_A)
            PPs.remove(Poi_A)
            Poi_B = NextPoi(Poi_A, PPs)
            Poi_A = Poi_B
        n = n + 1
        if n == 2:
            PPs.append(PoiStart)
    RList.append(PoiStart)

    XList = [i[0] for i in Data.Points]
    YList = [i[1] for i in Data.Points]
    X_OutList = [i[0] for i in RList]
    Y_OutList = [i[1] for i in RList]
    plot2D(XList, YList, X_OutList, Y_OutList)
-- Version 1.2 --
- Spel:
Graphical collections of "single line branching" are not supported.
#
# 不支持 “单线分支”的图形集合
#
import matplotlib.pyplot as plt
import Data1 as Data

def XYMaxPoint(PList):
    Xmax = max(i[0] for i in PList)
    Xlist = []
    for poi in PList:
        if poi[0] == Xmax:
            Xlist.append(poi)
    Ymax = max(i[1] for i in Xlist)
    return [Xmax, Ymax]

def NextPoi(P, PList):
    Unit = 1.0
    Poi_B = []
    TList = []
    Grid_4 = [[P[0] + Unit, P[1]], [P[0] - Unit, P[1]],
              [P[0], P[1] + Unit], [P[0], P[1] - Unit]]
    for i in Grid_4:
        if i in PList:
            TList.append(i)
    for A in TList:
        k = 1
        for B in TList:
            Wise = (A[0] - P[0]) * (B[1] - P[1]) - \
                (A[1] - P[1]) * (B[0] - P[0])
            if Wise < 0:
                k = 0
        if k == 1:
            Poi_B = A
    return Poi_B

def plot2D(x, y, x_out, y_out):
    plt.scatter(x, y)
    plt.plot(x_out, y_out)
    plt.show()

if __name__ == '__main__':
    PPs = Data.Points.copy()
    PoiStart = XYMaxPoint(Data.Points)
    Poi_A = PoiStart
    RList = []
    Poi_B = []
    n = 0
    while Poi_B != PoiStart:
        Poi_B = NextPoi(Poi_A, PPs)
        RList.append(Poi_A)
        PPs.remove(Poi_A)
        Poi_A = Poi_B
        n = n + 1
        if n == 2:
            PPs.append(PoiStart)
    RList.append(PoiStart)
    XList = [i[0] for i in Data.Points]
    YList = [i[1] for i in Data.Points]
    X_OutList = [i[0] for i in RList]
    Y_OutList = [i[1] for i in RList]
    plot2D(XList, YList, X_OutList, Y_OutList)